How to Use the Advanced Simulation and Analysis Tools
Introduction
This guide will walk you through using our physics simulation environment, from running a basic simulation to performing advanced data analysis using the integrated Desmos graphing tools. Follow these steps to explore physical relationships like a real scientist!
Step 1: Start the Simulation
To begin, simply click the Start button to get the simulation running.
Step 2: Change the Configuration Live!
This is where the fun begins. Once the simulation is running, we encourage you to actively change the simulation's configuration. For example, try adjusting the mass slider or typing in a new value while the simulation is running. You can do this multiple times during a single run. This allows you to see in real-time how the physics responds to your changes.
Step 3: Enter the Advanced Analysis View
When you are finished experimenting with the configuration, you can either wait for the simulation to end on its own or click the Advanced button to proceed directly to the analysis stage.

Step 4: Understand Your Data Tables
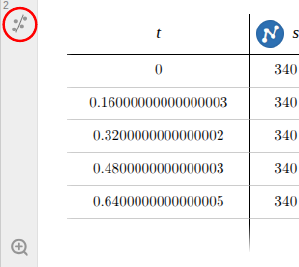
In the advanced analysis view, you will see Desmos populated with one or more data tables.
Each table represents a specific time period from your simulation, segmented by each time you changed a configuration. For example: - Table 1: Data from the start of the simulation until your first change. - Table 2: Data from your first change until your second change. - ...and so on.
Each table has a comment above it in Desmos explaining the period it represents.
Step 5: Run a Regression
Next to each table, you will find a button to Run Regression for that specific data set. Clicking this will perform a regression analysis on the data in that table and determine the function that best fits it.
Step 6: Graph the Function and Find the Derivative
This is a multi-part step to get your regression onto the graph for analysis.
-
Write the Equation: After running a regression, click the Write Equation button. This will add the calculated equation to the Desmos expression list on the left.

-
Define the Function f(x): You must now make a small manual change. Find the equation that was just added (e.g.,
y = 3x + 2) and change theytof(x).So,
y = 3x + 2becomesf(x) = 3x + 2.Important Note: Desmos needs to know which function you want to analyze. For the derivative feature to work correctly, please ensure that only one function is defined as
f(x)at a time. If you want to analyze a different regression, you must delete or disable the currentf(x)expression before defining a new one. -
View the Derivative: Once your function is correctly defined as
f(x), you can simply check the Show Derivative checkbox. The derivative of your function will instantly be plotted on the graph!